

Recently I ran into a rather interesting deadlock in an HPC development project. Tracking down the issue required a bunch of interesting tools, but I’ll save some of the story for next time.
After logging into a deadlocked node, I fired up the first line of defense – GDB. OK, lets get a backtrace of where all my threads are:
thread apply all bt

2220 threads! Something must be going wrong with the third party scheduler. But the operating system can handle even more concurrent threads, so although I can’t condone spawning a few thousand threads in a process, I can’t point my finger at the scheduler and go on vacation.
The real problem here – how am I supposed to dig through a few thousand stack traces?
A typical gdb stack trace contains a set of frames, where a frame consist of a function address and then debugging info such as the function name, arguments and line number, depending on the amount of information available to the debugger. In a lot of HPC code, the same functions tend to get called by many various threads with different arguments, so the function address and callstacks tend to be quite similar. Thus, we can leverage the function addresses as unique identifiers and reduce the total number of backtraces we really need to read.
First, lets dump all of the backtraces to a log file using gdb’s logging. I’m on host 12 of 25, so I’ll log to “ghosts12.log”:set logging onset logging file ghosts12.logthread apply all bt
Next, I’ll use a python script I wrote to parse through the log file:
[code language="python"]
def unique_check(filename):
stacks = {} #create a dictionary to store our stack traces
f = open(filename)
f.readline()
stack = '' #create an empty string to append stack trace lines
addrs = '' #will use the callstack addresses as a unique identifier
while True:
line = f.readline()
if not line: #check for end of file
break
if "Thread " in line: #signal both the end of the current stack and the start of a new stack
if addrs not in stacks: #create a new entry in the stacks dictionary
stacks[addrs] = {'c':1,'stack':stack}
else: #update the count in the stacks dictionary
stacks[addrs]['c'] += 1
stack = '' #reset the stack trace string
addrs = '' #reset the stack identity
else:
stack += line #the line is probably a frame description, add it to the stack
try:
addrs += line.split()[1] #if the line is a frame, add the address to addrs
except:
pass
f.close()
print "Found", len(stacks),"unique stacks:"
for stack in stacks:
print "Appearing", stacks[stack]['c'],"times:"
print stacks[stack]['stack']
[/code]
With that, I get the far more pleasant result:
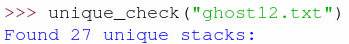
Ah! Now that’s much more manageable, I can probably find something useful if I only need to read through 27 callstacks.
Stay tuned for the next chapter!
We are ready to accelerate your business forward. Get in touch.
Tell us what you need and one of our experts will get back to you.